How-To Access Service Logs
| This page describes how to access the logs of a VSHN service deployed on APPUiO Cloud. |
Via the Command Line
Each service provided by VSHN is deployed in its own namespace. The access to those namespaces is deliberately limited, for more information see Namespace Permissions.
It is possible to list and view the logs of all pods in those namespaces.
kubectl get <vshn-service> -o custom-columns="KIND":.kind,"NAME":.metadata.name,"INSTANCE NAMESPACE":.status.instanceNamespace (1)
KIND             NAME         INSTANCE NAMESPACE
VSHNRedis        app1-prod    vshn-redis-app1-prod-rt4w5
VSHNPostgreSQL buzz vshn-postgresql-buzz-qvgrd| 1 | vshn-service can be any of vshnredis, vshnkeycloak, vshnmariadb, vshnpostgresql etc. |
Once the instance namespace is identified, it’s possible to list the pods within it, in this case all pods of our redis instance.
oc -n vshn-redis-app1-prod-rt4w5 get pods
NAME             READY   STATUS    RESTARTS   AGE
redis-master-0   1/1     Running   0          105m
After the correct pod has been found the logs can be shown as usual via the CLI. For our example we look at the logs of the redis pod.
oc -n vshn-redis-app1-prod-rt4w5 logs redis-master-0
1:C 17 Mar 2023 10:21:19.049 # oO0OoO0OoO0Oo Redis is starting oO0OoO0OoO0Oo
1:C 17 Mar 2023 10:21:19.049 # Redis version=7.0.9, bits=64, commit=00000000, modified=0, pid=1, just started
Via Kibana
Please consult Access Logs Through Kibana for general access to Kibana.
In order to show the logs of a VSHN services, you need to know first the namespace where it’s deployed. Please consult the Via the Command Line section for a how-to.
By default Kibana will show all logs available.
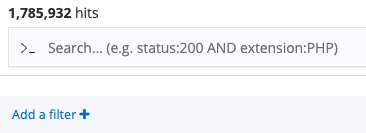
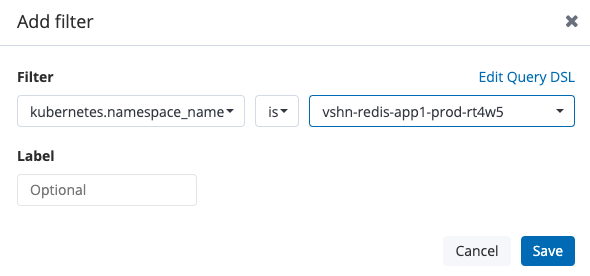
To limit it to the instance namespace use the filter kubernetes.namespace_name as shown on the images below.
-
Add a filter to Kibana

-
Then filter per namespace

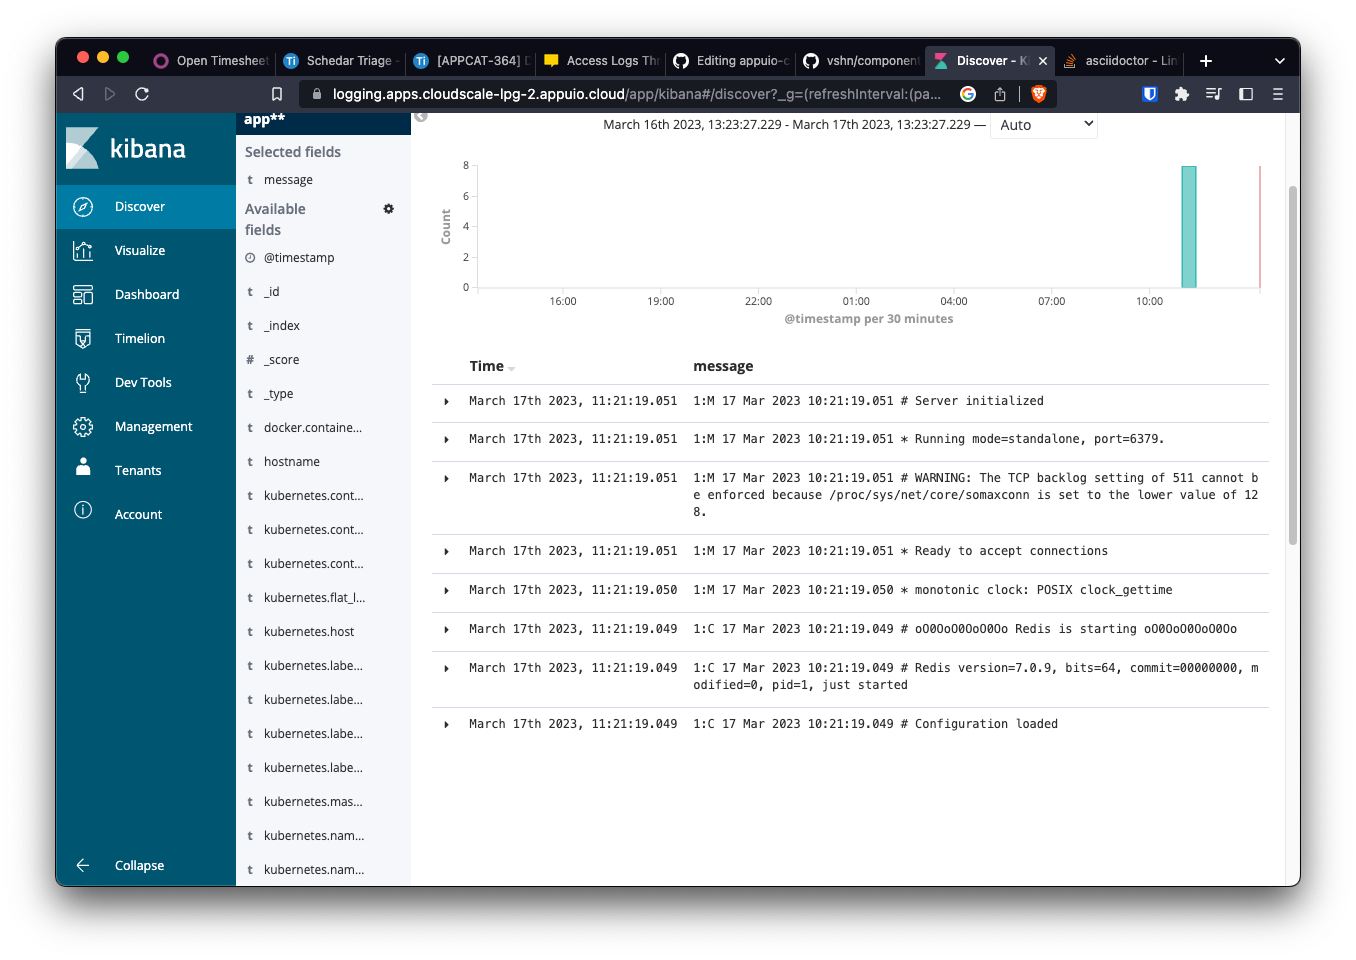
Afterwards Kibana will show all logs, filtered to the requested instance.
