Access VSHN Managed Services metrics in Openshift console
You can browse VSHN Managed Services metrics in Openshift console. To do that, please follow below steps:
-
Login to Openshift console
-
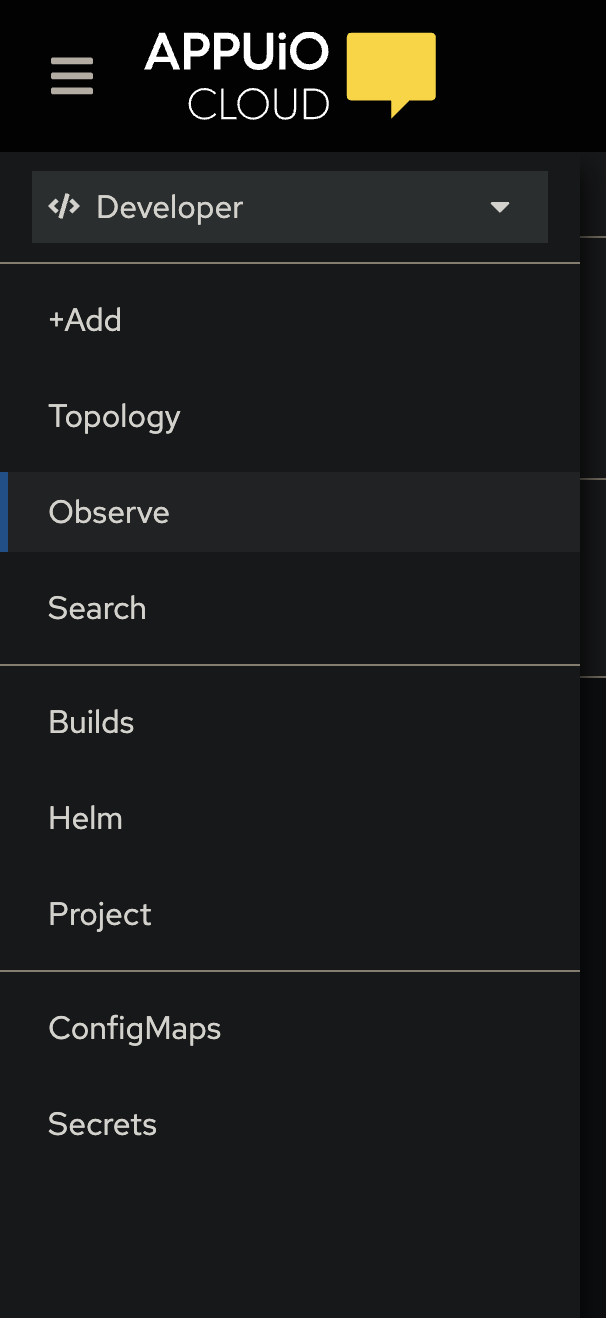
Ensure You’re working in
Developer Mode -
In left sidenav go to
Observetab
-
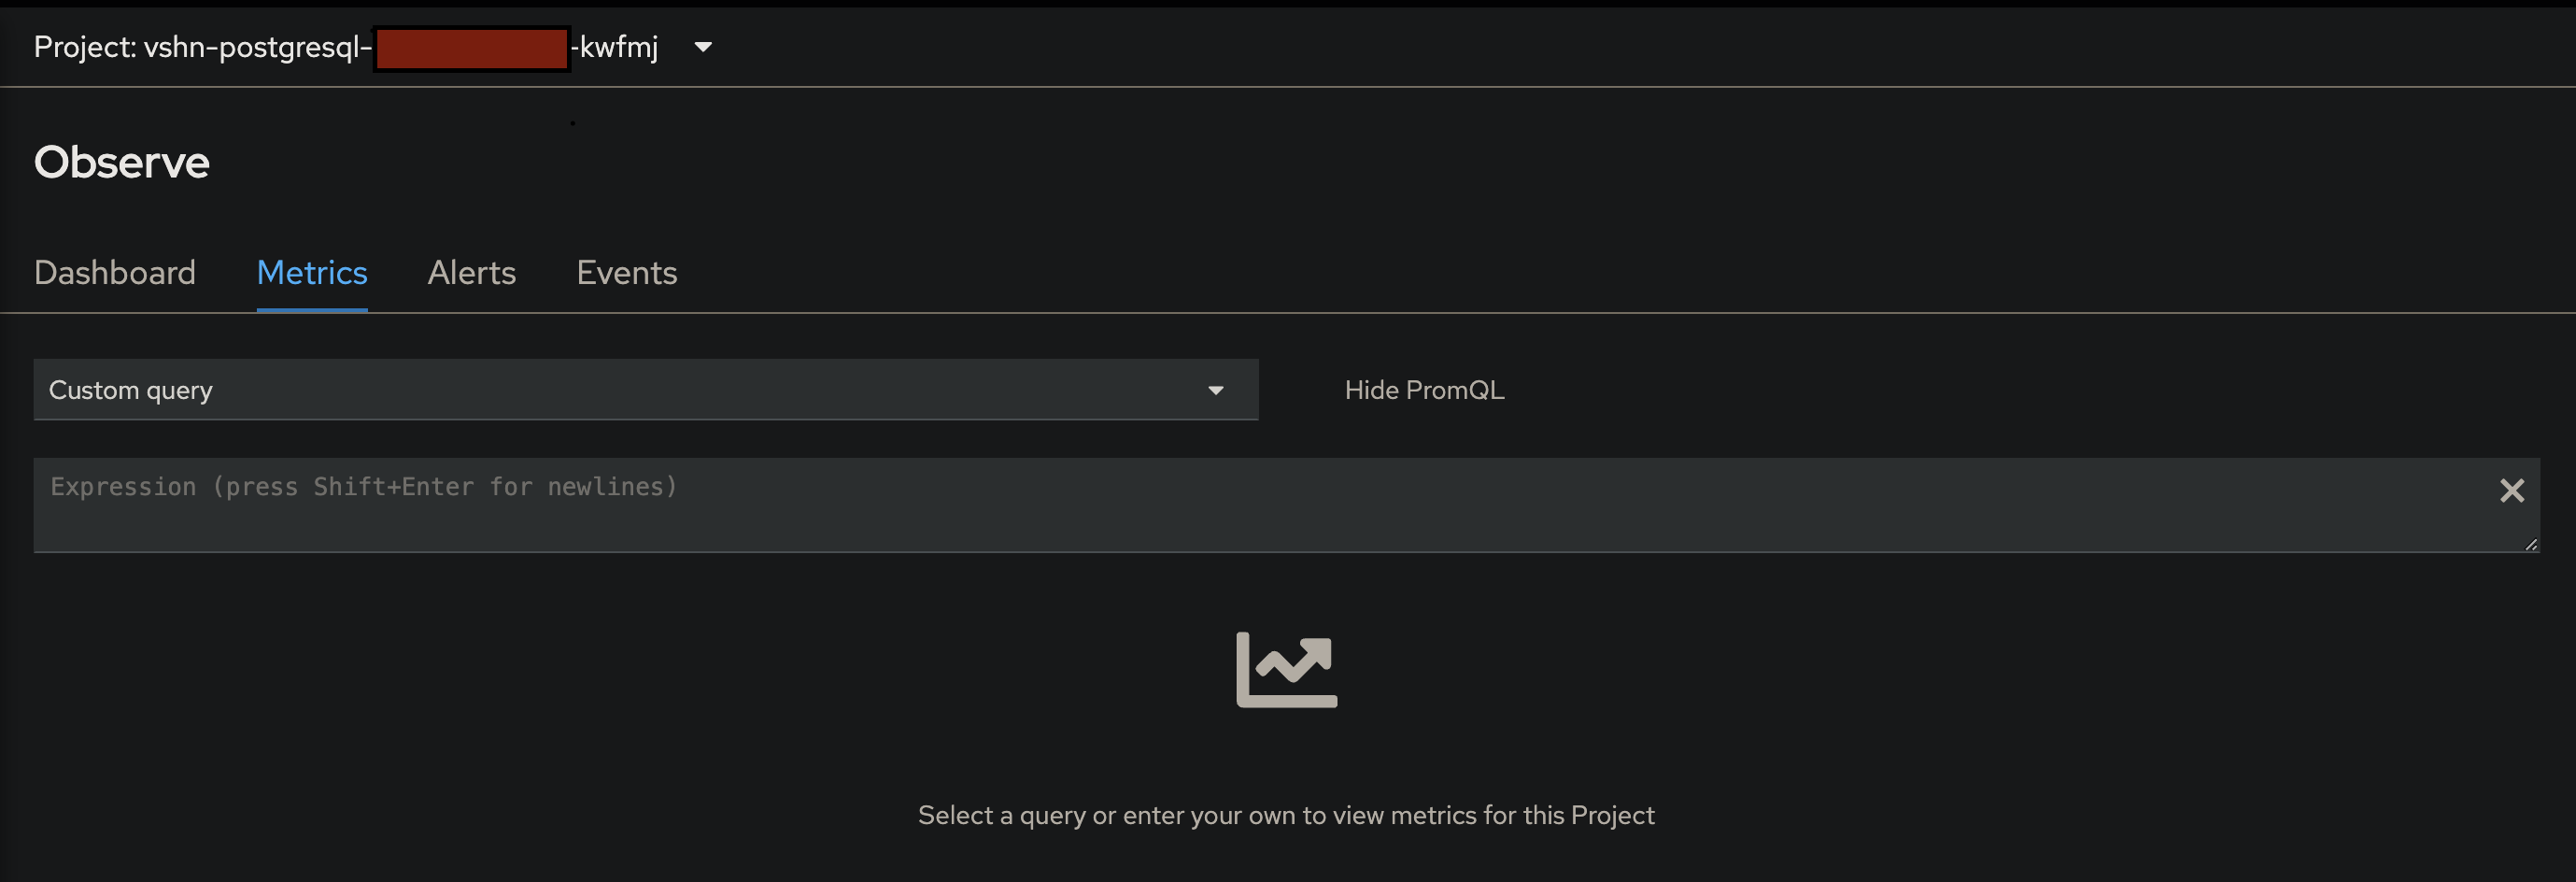
Switch to project (namespace) of Your choice
-
Browse Your metrics
You can check Dashboard for preconfigred metrics and charts.
If You want to query prometheus database using custom query, please switch to Metrics tab, then from Select chose Custom query. For PostgreSQL namespaces You should have access to all metrics provided by PostgreSQL Exporter.
Custom PromQL:
